You don't need to be signed in to read BMJ Blogs, but you can register here to receive updates about other BMJ products and services via our site.

Usage data

New twitter analytics: how many people see your tweets?

1 Sep, 14 | by BMJ

Back in July, Twitter launched an impressive analytics dashboard that was only accessible by advertisers and verified users. As of last week, however, this wealth of data became available to the public.

A bit like Google Analytics for tweets, this new toolkit allows you to gauge the performance of each and every tweet you send. Twitter users can identify in real time which tweets are getting the most attention and therefore determine the best strategies for reaching their audience.

To view your Tweet activity dashboard, visit analytics.twitter.com whilst logged into your account.

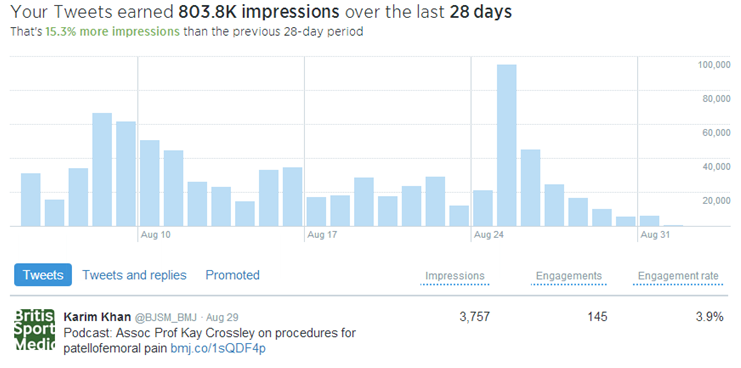
The first dashboard tab in Twitter analytics provides an overview of your tweets’ performance. You can find numbers for impressions, engagement, link clicks, retweets, favorites and replies. Twitter also offers measurement data for the previous 28 days so you can see how today’s performance compares to past performance.

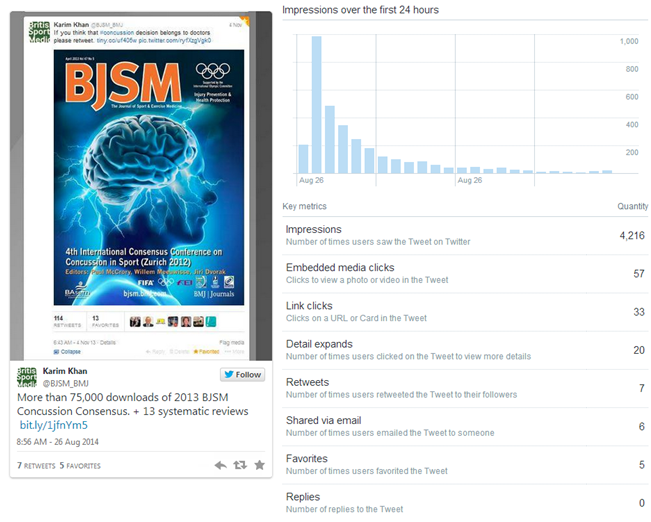
Clicking on individual tweets also reveals more data, including the number of impressions over the past 24 hours, plus other valuable metrics like:

  • User profile clicks (clicks on name, @handle, or Twitter author profile photo
  • Retweets
  • Embedded media clicks (clicks to view a photo/video when applicable)
  • Detail expands (# of times a user clicked to view details of a tweet)
  • Favorites
  • Replies
  • Link clicks (clicks on URL or Twitter card)

As a bonus, all this data can be easily exported. The exported table data includes the full tweet text, the tweet permalinks, plus extra information like:

  • Timestamps
  • Hashtag clicks
  • App opens
  • Follows
  • Tweets emailed

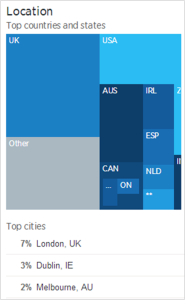
In the next dashboard tab marked ‘Followers,’ marketers can track follower growth and extract important follower data.

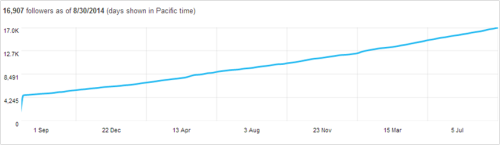
You’ll see trends in your follower count displayed by a line chart and demographic data including:

  • # of followers in different locations
  • Your followers’ gender
  • Other accounts that your followers also follow
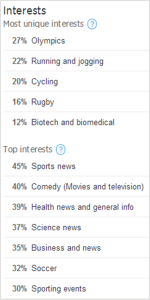
  • Your followers’ top interests
  • Your followers’ ‘unique’ interests

Picture3 Picture4

So, what does all this mean? Social media measurement just got easier. Twitter analytics can’t fail to help marketers measure social media performance and therefore become more adept at matching Twitter activities to business goals.

Dark social: should publishers be afraid of the dark?

13 Nov, 13 | by BMJ

Have a look at any website’s analytics and ‘direct traffic’ will appear as a source alongside referrers such as Google, Facebook and Twitter. It is widely assumed that this ‘direct traffic’ is made up of users bookmarking the site or typing a site’s URL directly into a browser. However, will many readers really type out a long article URL? Isn’t it more likely that the link has been shared in a private network, such as instant messengers or email, rather than typed?

As email clients and instant messaging platforms such as Skype are not recognised as referrers, links clicked on within these networks have had referral data stripped and therefore show as ‘direct traffic’. Known as ‘dark social‘, this is the more mysterious type of traffic, where links are shared in a private yet social way.

more…

Followerwonk: analyse your Twitter followers for free

8 Mar, 13 | by BMJ

If you’re looking to connect with people in a particular niche on Twitter, Followerwonk could be just the tool for you. It’s currently free to search Twitter biographies, compare users and analyse followers of multiple accounts, so try it out before subscriptions kick in.

What can I find out about my followers?

By linking a Twitter account to Followerwonk, users can run a number of different analytic reports for free. Below is a list of the most useful for strategically growing a following and connecting with ‘influencers’ in a specific area:

  • Influence scores – how influential are your followers?
  • Follower counts – how many followers do your followers have?
  • Mapped locations – where are your followers located? (see below) more…

BrainSpace: building a social brain

23 Nov, 12 | by BMJ

BrainSpace, a potential solution to outdated search technology, was demonstrated at this year’s SpotOn London. Launched by PureDiscovery, a big data startup, its goal is to let users find information that matters without having to actually look for it. Instead, the technology is designed to bring data directly to the user.

 BrainSpace is already well-established in the world of archived content; it powers semantic search across more than 350 million documents for LexisNexis. PureDiscovery, however, has set its sights much higher. By not only determining relationships between documents, but also between between people, and people and documents, it is gearing up to create a ‘social brain’ which will revolutionise search. more…

Crowdbooster: when is your best time to tweet?

15 Nov, 12 | by BMJ

In a very popular ‘Assessing social media impact’ session at SpotOn London this week, a number of social media tools were discussed. Twentyfeet cropped up (mainly due to the visibility of its automated weekly updates on free accounts) along with Klout and PeerIndex, with varying degrees of enthusiasm from participants.

The most interesting take-away for me personally was an introduction to Crowdbooster. It’s a free tool that lets you pull together statistics for one Twitter and one Facebook account. (If you want to add multiple accounts, you’ll need to pay).

more…

Mendeley: reducing the lag in research impact analysis

9 Aug, 12 | by BMJ

Mendeley, the free reference manager and academic social network, has released an Institutional Edition for research and impact analysis and signed up a number of leading academic establishments along the way.

Announced on Monday, Mendeley Institutional Edition (MIE) is a module developed to give librarians and heads of library insight into the way researchers work and use their library collection at document level. By offering the MIE to their end users, institutions can seemingly stimulate their productivity and gain real-time feedback on the usage of library content.

more…

How to Get More Likes, Comments and Shares on Facebook

20 Jun, 12 | by BMJ

For those looking improve engagement with their Facebook posts, it seems that adding more pictures and speaking in the first person is a good place to start. Social media ‘scientist’ Dan Zarrella has tracked and analysed more than 1.3 million posts from the 10,000 most-liked Facebook pages. He has created an infographic (see below) showing what kind of posts perform best on Facebook in terms of likes, shares and comments.

Photos perform best across the board, followed by text and video, according to the data. News links bring in the lowest number of likes, shares and comments. In opposition to Twitter, posts with a high number of self-referential words such as “I” and “me” get more likes .  “It’s also important to be passionate, not neutral,” which means that both positive and negative posts tend to do well. more…

How does content “go viral” through social networks?

28 May, 12 | by BMJ

You may (or may not) have noticed that having blogged every Friday for over 2 years, there was a distinct lack of activity on the BMJ Web Development blog last week. Was I out enjoying the sunshine? Absolutely not. I was in the office researching the best time to disseminate blog posts on social media networks, of course.

more…

Total-Impact: tool for researchers combines traditional and alternative metrics

24 Feb, 12 | by BMJ

“As the volume of academic literature explodes, scholars rely on filters to select the most relevant and significant sources from the rest,” the altmetrics manifesto argues. “Unfortunately, scholarship’s three main filters for importance are failing.” Peer review “has served scholarship well” but has become slow and unwieldy and rewards conventional thinking. Citation-counting measures such as the h-index take too long to accumulate. And the impact factor of journals gets misapplied as a way to assess an individual researcher’s performance, which it wasn’t designed to do.

There are various tools that provide an easy interface for finding out readership metrics for a researcher. Until recently, none of these allowed users to choose what is included or enabled non-traditional artefacts to be combined with traditional ones. This is where Total-Impact, a new offering from the altmetric community, comes in. more…

Mendeley/PLoS API Binary Battle – the finalists

18 Nov, 11 | by BMJ

PLoS and Mendeley recently closed their Binary Battle contest to build the best apps that make science more open using PLoS and/or Mendeley’s APIs (Application Programming Interface). There are some big names on the judging panel, such as Tim O’Reilly (coined the term ‘Web 2.0’), James Powell (CTO of Thomson Reuters) and Werner Vogels (CTO of Amazon.com).  The entries have been whittled down to 11 finalists and the winner will be announced on 30th November 2011. Read on for details of some of these finalists or go here a full list: http://dev.mendeley.com/api-binary-battle more…

BMJ Journals Development blog homepage

BMJ Web Development Blog

Keep abreast of the technological developments being implemented on the BMJ journal websites.


Creative Comms logo